80% of those in their 70s believe "healthy people are cool" and women in their 70s invest the most in health
Dentsu Inc. (President & CEO: Takeshi Sano; Head Office: Tokyo) announced the results of its 19th Wellness Survey of 10,000 People, targeting men and women living in Japan in their 20s-70s. The survey was conducted by the Dentsu Healthcare Team, a specialized organization offering a multitude of services ranging from the development of strategies and business models to market entry and public relations campaigns in the healthcare market.
Conducted annually since 2007, the survey identifies emerging trends and needs in Japan's healthcare sector, based on consumer health awareness and behaviors. This year, for the first time, the survey included respondents in their 70s. It also introduced a revised healthcare cluster classification system, which divides consumers into eight types. The main findings of the survey are as follows.
Key Findings
1.Regarding overall health awareness and behaviors, the percentage of respondents who believe "healthy people are cool" increases with age, peaking at approximately 80% among those in their 70s. The willingness to join communities of people with similar health concerns and the desire to be recognized by others for their efforts towards health increases with younger age groups, being highest among those in their 20s.
2.Monthly spending on health-related products and services is highest among women in their 70s. Compared to women in their 30s (the lowest spenders), women in their 70s spend approximately 2.4 times more on products and 2.1 times more on services.
3.The proportion of people recording sleep patterns and diet on smartphones or using smart devices to measure metrics such as heart rate is highest among men in their 20s. For recovery wear, clothing designed to aid fatigue recovery, a significant gap is seen between current usage rates and future usage intentions.
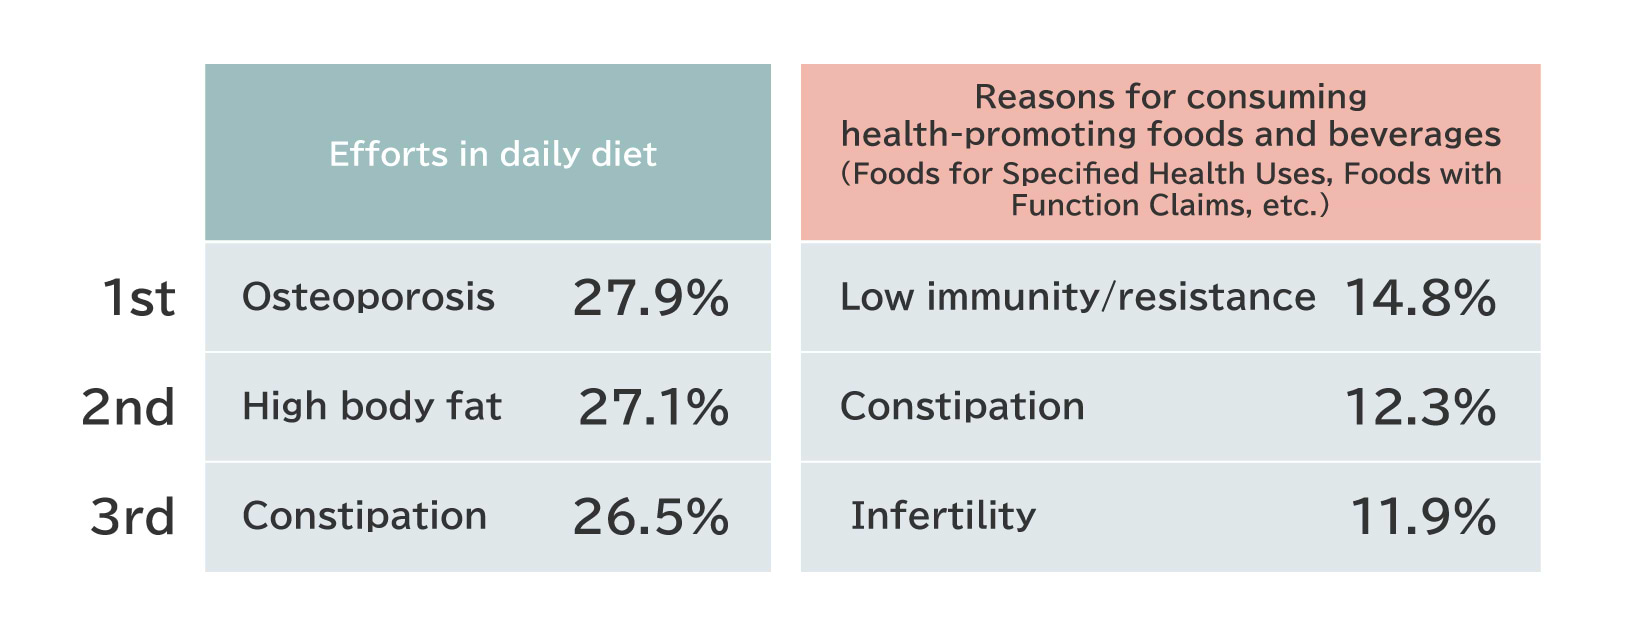
4.Among the 45 health conditions surveyed, the one most commonly addressed through daily dietary habits is osteoporosis (27.9%). The condition most commonly addressed using health foods and drinks, such as Foods for Specified Health Uses (FOSHU), is immunity/resistance (14.8%).
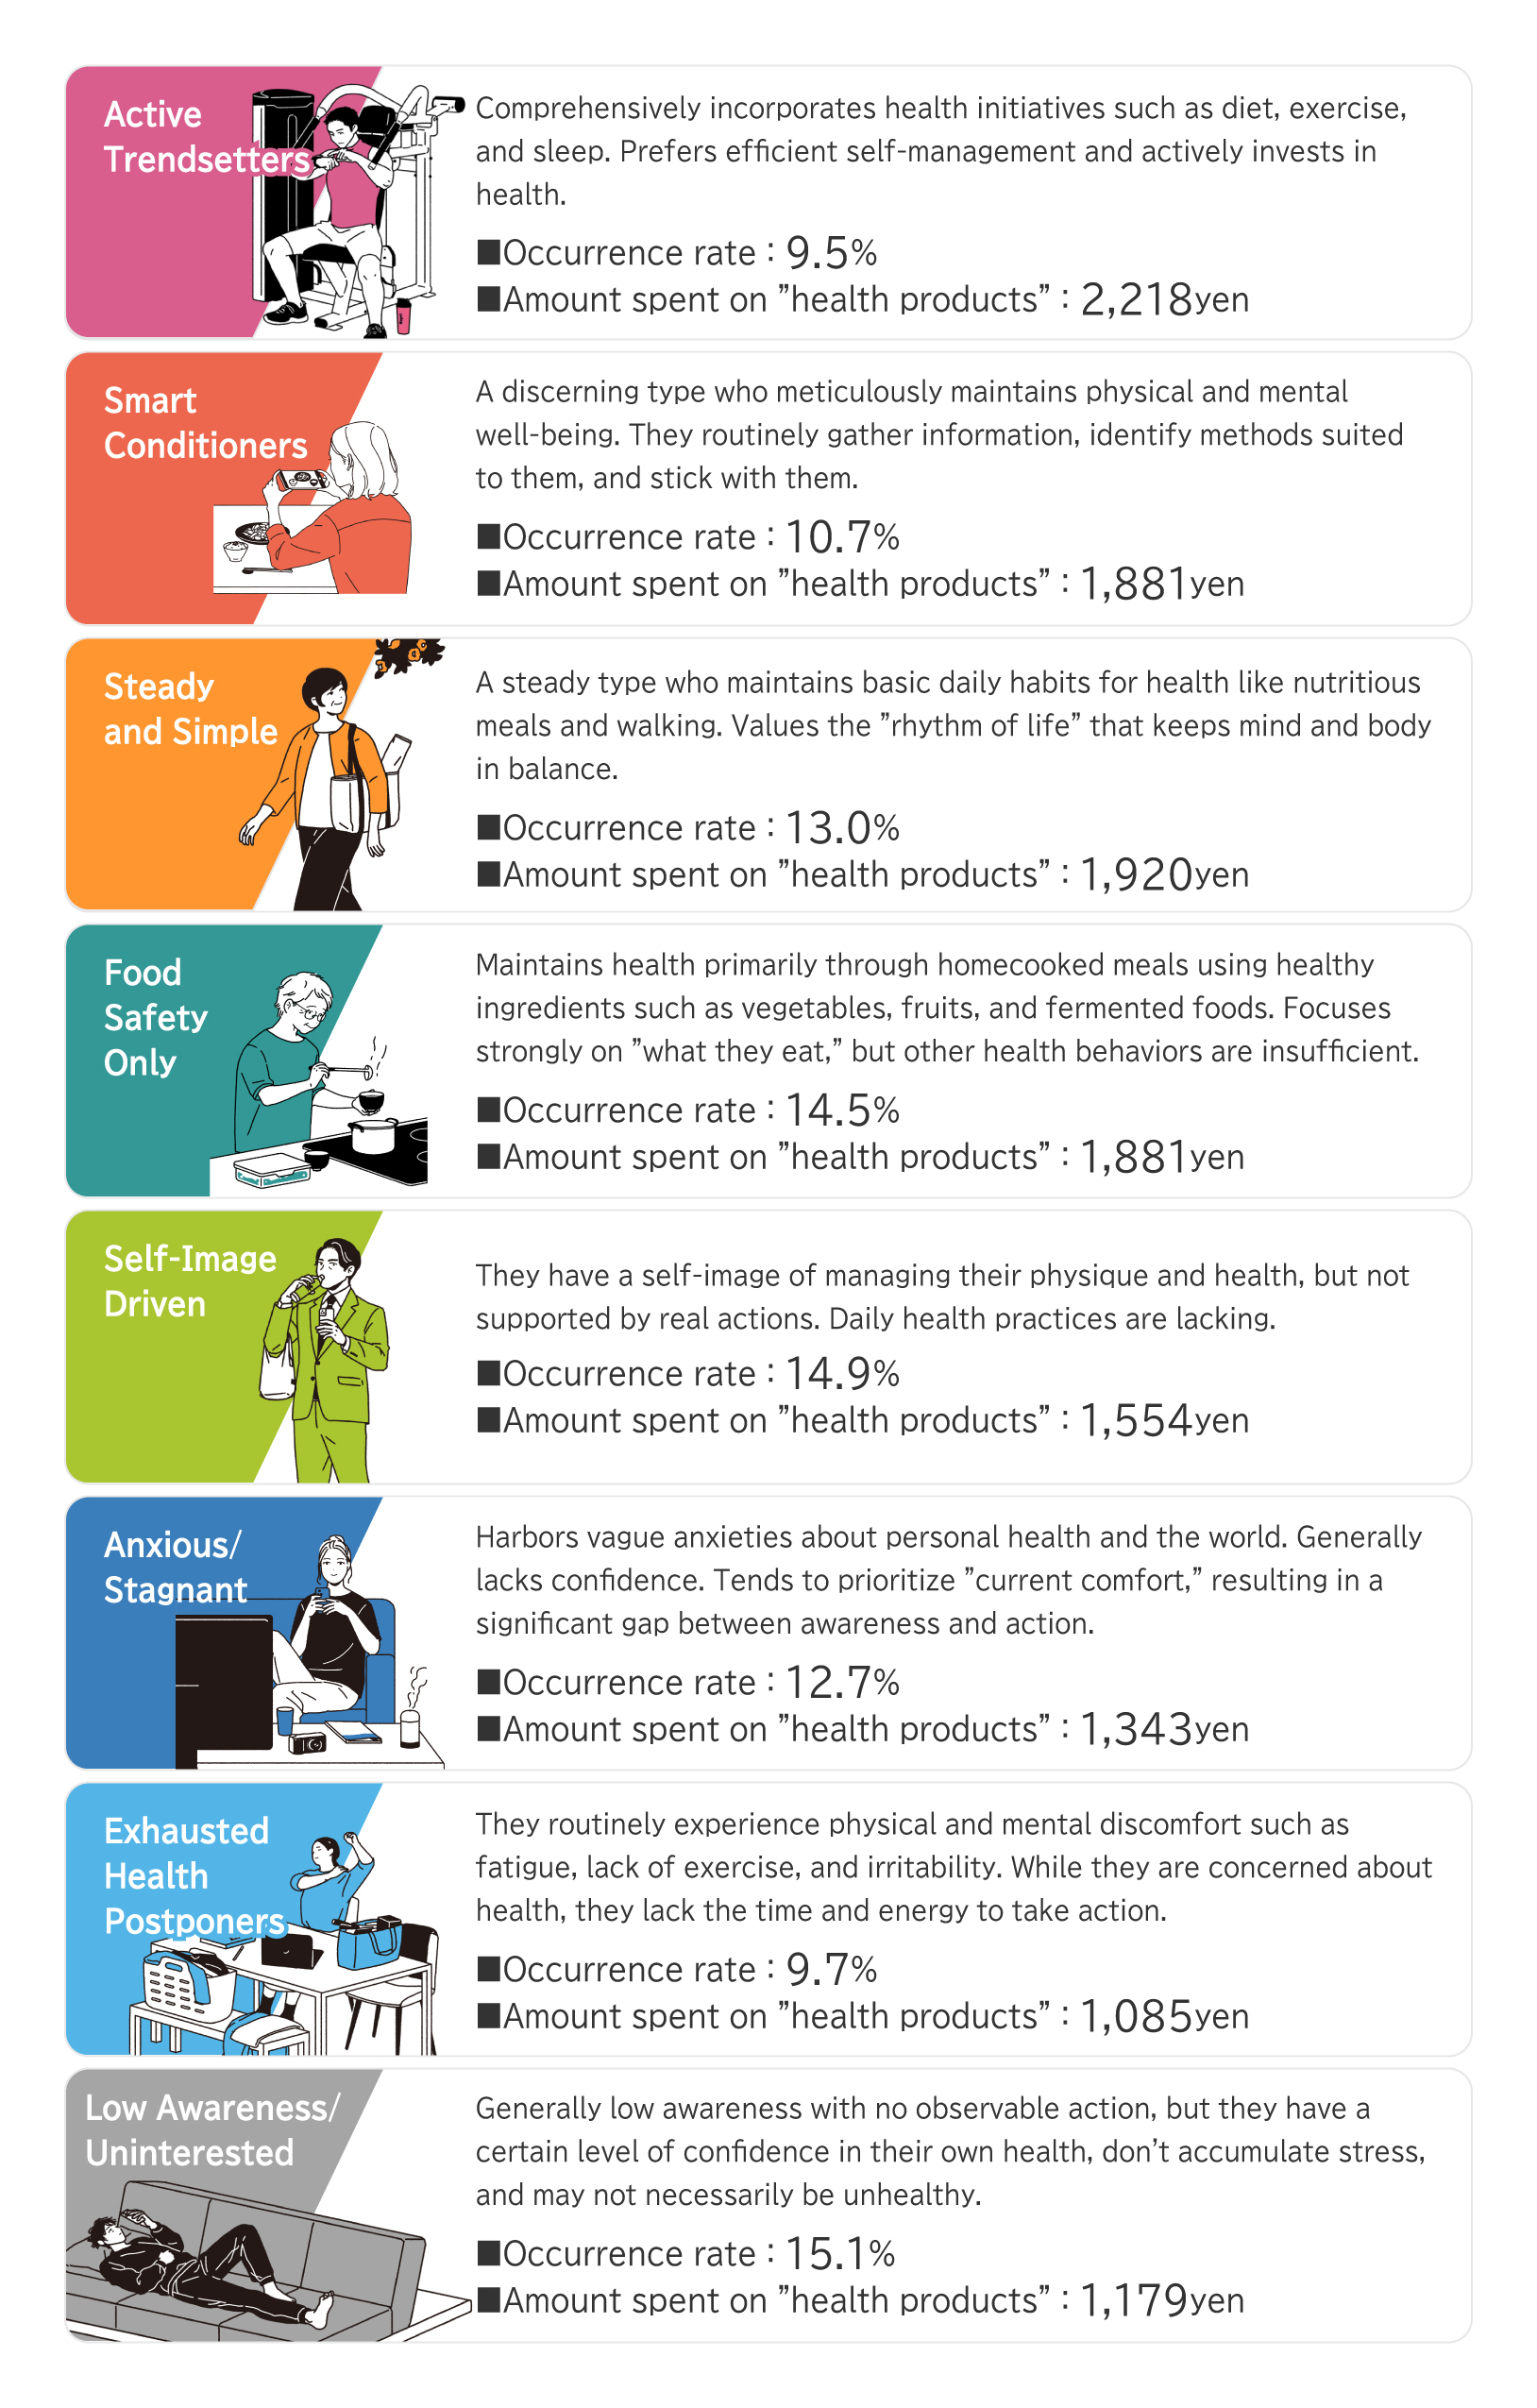
5.In the updated healthcare cluster classification system, which categorizes consumers (now including those in their 70s) into eight groups, new clusters reflecting contemporary trends emerged. These include the Smart Conditioners, who meticulously manage their physical and mental conditioning, and the Exhausted Health Postponers, who are concerned about health but rank it lower in priority due to busyness and fatigue of daily life.
Note: The percentage figures of the survey results have been rounded to the nearest hundredth and may not always add up to 100%.
Details of Findings
1. Regarding overall health awareness and behaviors, the percentage of respondents who believe "healthy people are cool" increases with age, peaking at approximately 80% among those in their 70s. The willingness to join communities of people with similar health concerns and the desire to be recognized by others for their efforts towards health increases with younger age groups, being highest among those in their 20s.
- The percentage of people who think "healthy people are cool" is highest among those in their 70s at 79.2%, and lowest among those in their 20s at 53.1%. (Chart 1)
- The percentage of people who are "interested in or would like to join a community of people with similar health concerns and goals" is highest among those in their 20s at 32.0%, while those in their 70s are the lowest at 12.6%. (Chart 2)
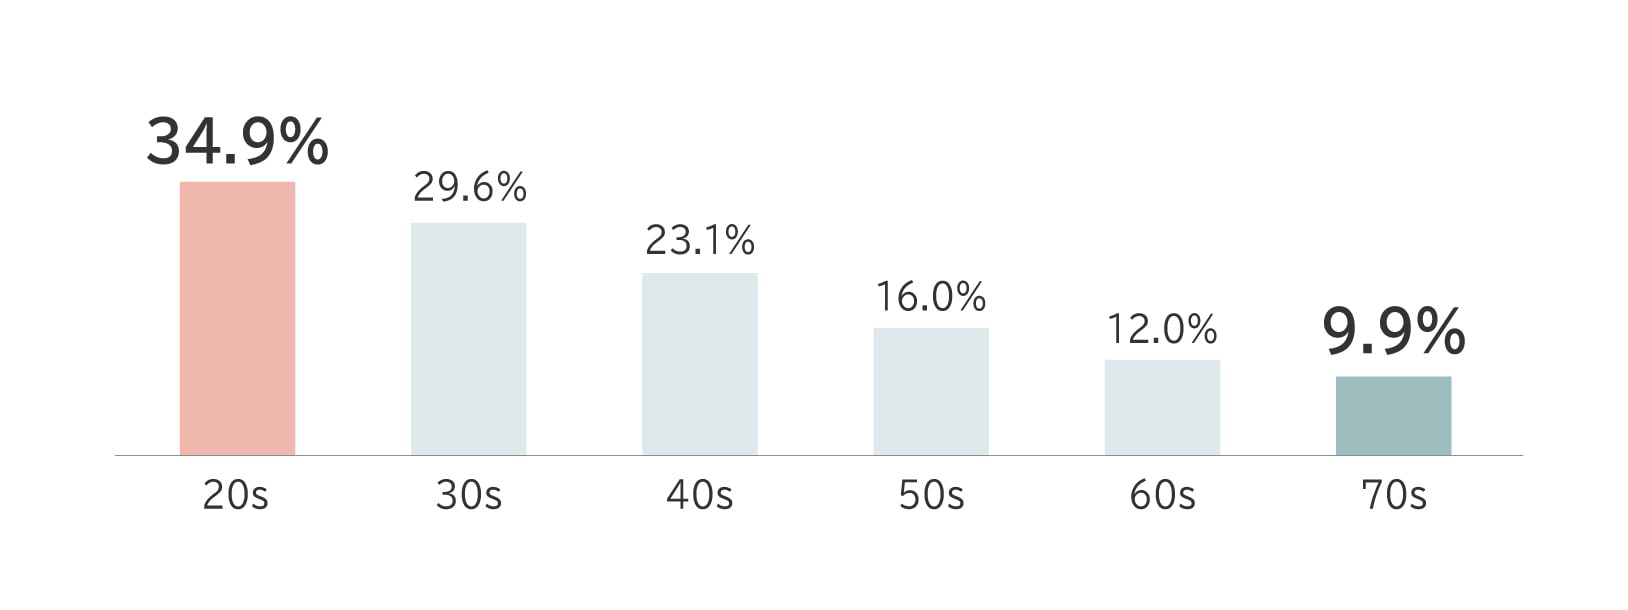
- The percentage of people who think "I want my efforts for my body and health to be recognized or praised by those around me" is highest among those in their 20s at 34.9%, while it is lowest among those in their 70s at 9.9%. (Chart 3)
Chart 1
Q. To what extent do the following items apply to you? Please indicate for each. (n:10,000)
The combined percentage of respondents who answered "Strongly agree" or "Somewhat agree" to the statement "I think healthy people are cool."
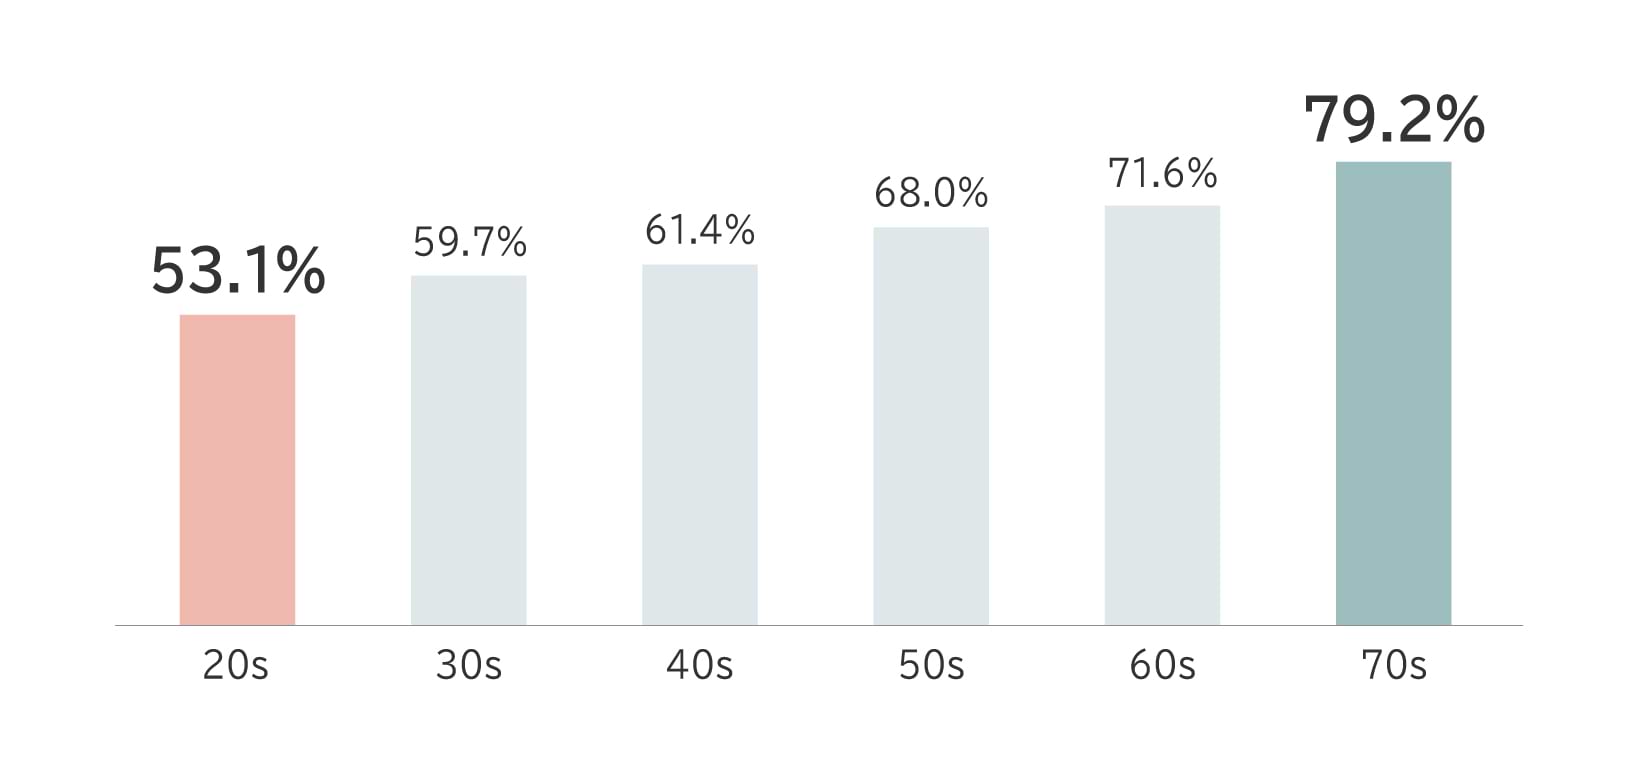
Chart 2
Q. To what extent do the following statements apply to you? Please indicate for each. (n:10,000)
The combined percentage of respondents who answered "Strongly agree" or "Somewhat agree" to the statement: "I am interested in or would like to join a community of people with similar health concerns and goals."
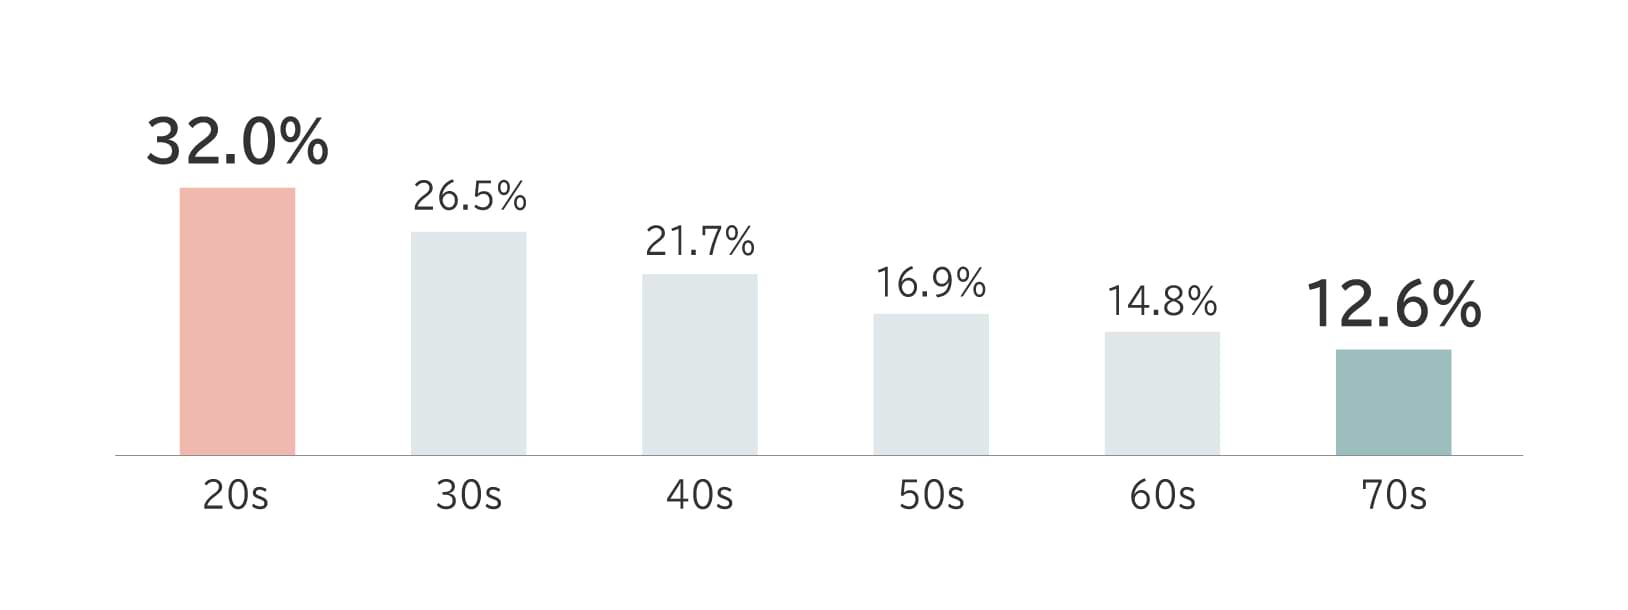
Chart 3
Q. To what extent do the following items apply to you? Please indicate for each. (n:10,000)
The combined percentage of respondents who answered "Strongly agree" or "Somewhat agree" to the statement: "I want my efforts for my body and health to be recognized or praised by those around me."
 2. Monthly spending on health-related products and services is highest among women in their 70s. Compared to women in their 30s (the lowest spenders), women in their 70s spend approximately 2.4 times more on products and 2.1 times more on services.
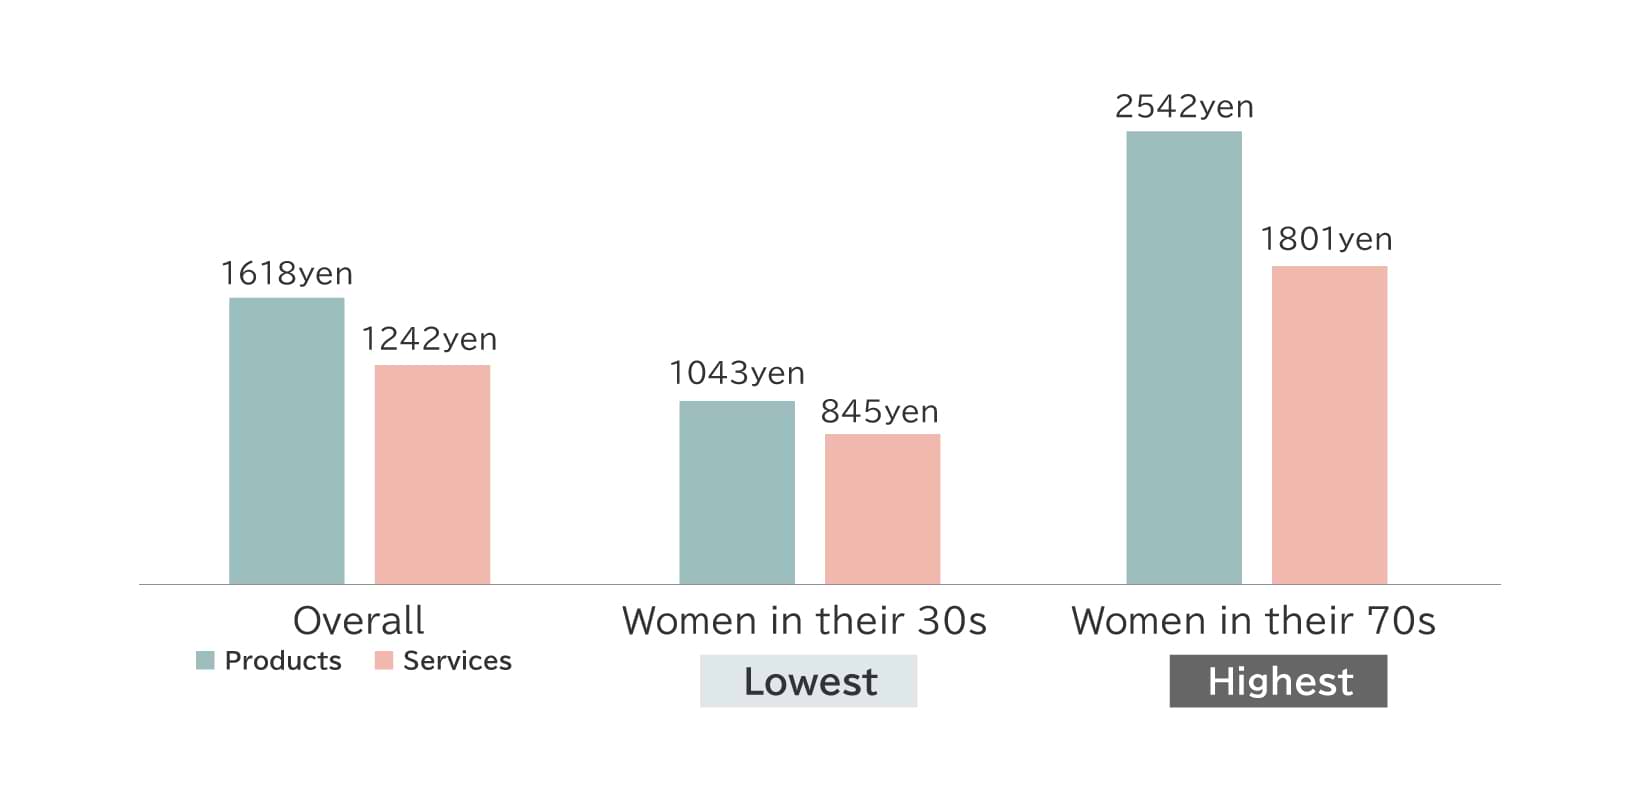
- The monthly amount spent on health-related products (such as supplements, health foods, and drinks) is 1,618 yen. The difference between the highest spenders (women in their 70s at 2,542 yen) and the lowest (women in their 30s at 1,043 yen) is approximately 2.4 times. (Chart 4)
- The average monthly amount spent on health-related services (such as fitness and massage) is 1,242 yen. The difference between the highest spenders (women in their 70s at 1,801 yen) and the lowest spenders (women in their 30s at 845 yen) is approximately 2.1 times. (Chart 4)
Chart 4
Q. How much do you spend per month on health products (such as supplements, health foods, and drinks)?
Q. How much do you spend per month on health services (such as fitness, massage, or healthcare apps)?
 3. The proportion of people recording sleep patterns and diet on smartphones or using smart devices to measure metrics such as heart rate is highest among men in their 20s. For recovery wear, a significant gap is seen between current usage rates and future usage intentions.
- Regarding the use of health tech products and services, the proportion recording sleep patterns and diet on smartphones or similar devices is highest among men in their 20s for both: 28.5% record sleep patterns and 25.1% record diet. (Chart 5) (Chart 6)
- Overall, 10.8% currently use wearable devices like smartwatches that measure metrics such as heart rate, steps, and sleep quality. By gender and age group, men in their 20s had the highest rate at 17.6%, followed by men in their 70s (15.2%). (Chart 7)
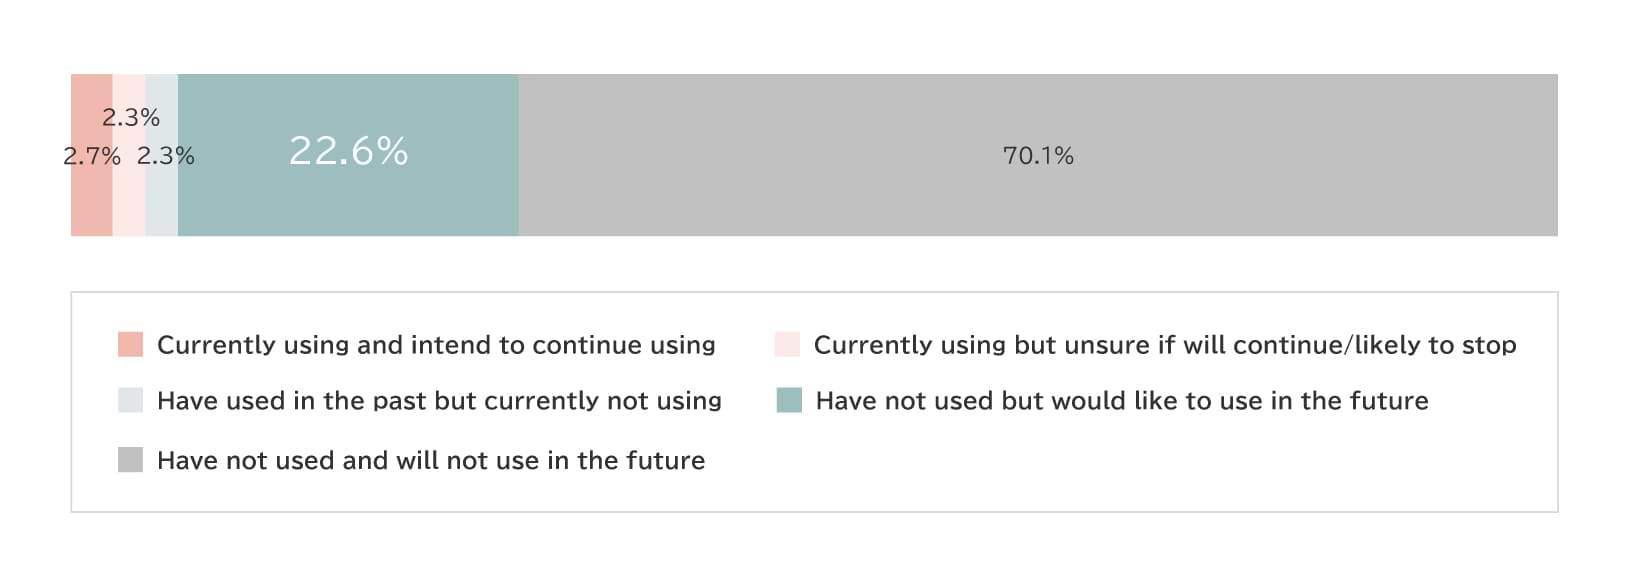
- While the current usage rate of recovery wear--designed to aid fatigue recovery and promote blood circulation--remained at 5.0%, the proportion of people who "have never used it but would like to in the future" reached 22.6%. (Chart 8)
Chart 5
Q. Do you currently engage in the following activities? Please indicate for each. (n:10,000)
The combined percentage of respondents who answered "Always/Often" or "Sometimes" for the item "Measuring/recording sleep status using a wearable device or smartphone."
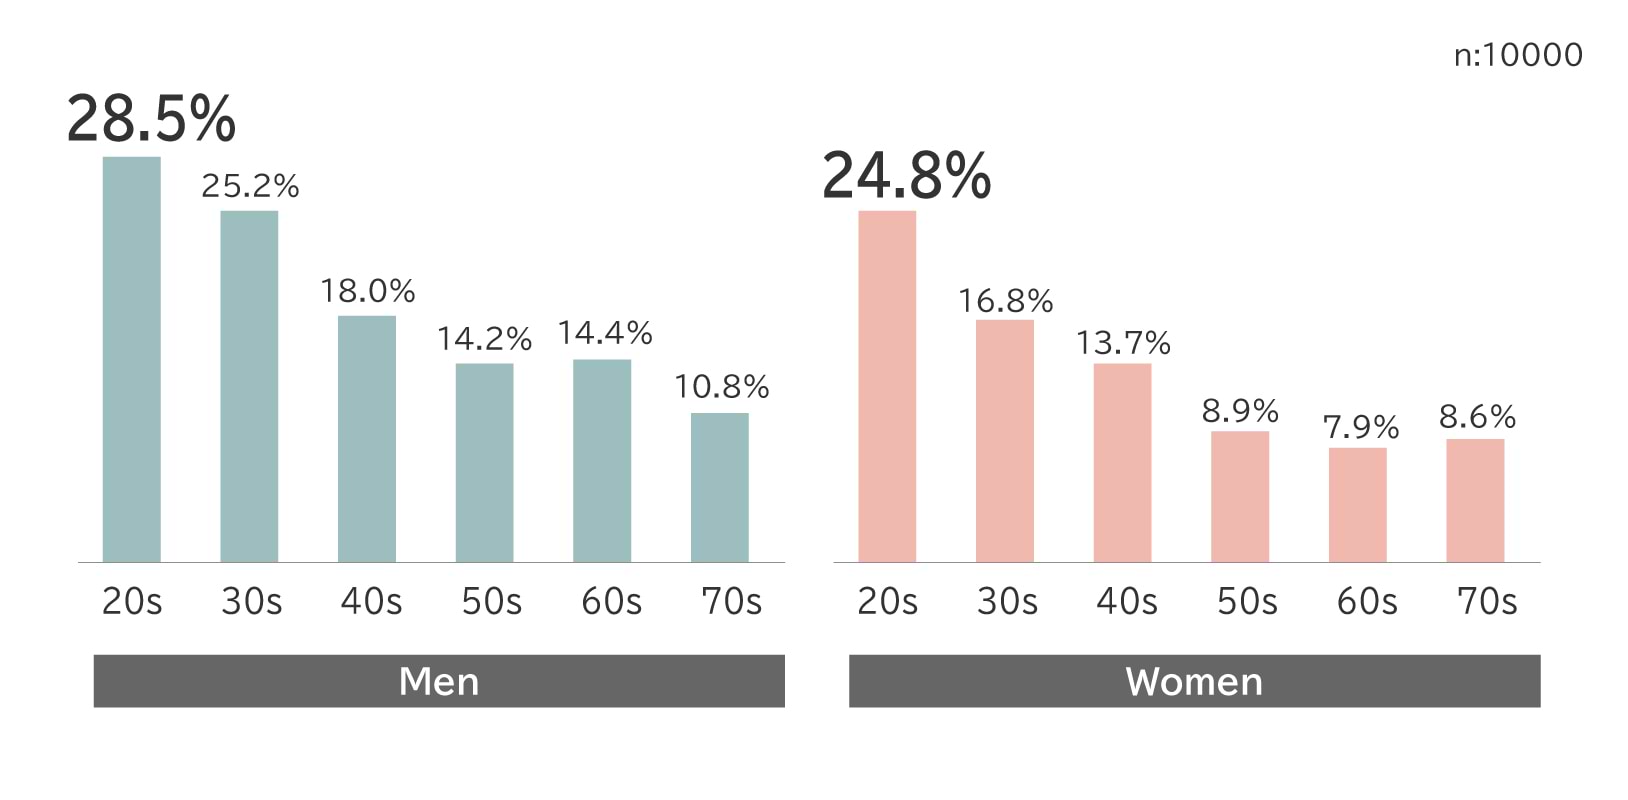
Chart 6
Q.Do you currently engage in the following activities? Please indicate for each. (n:10,000)
The combined percentage of respondents who answered "Always/Often" or "Sometimes" for the item "Record/manage diet using a smartphone."
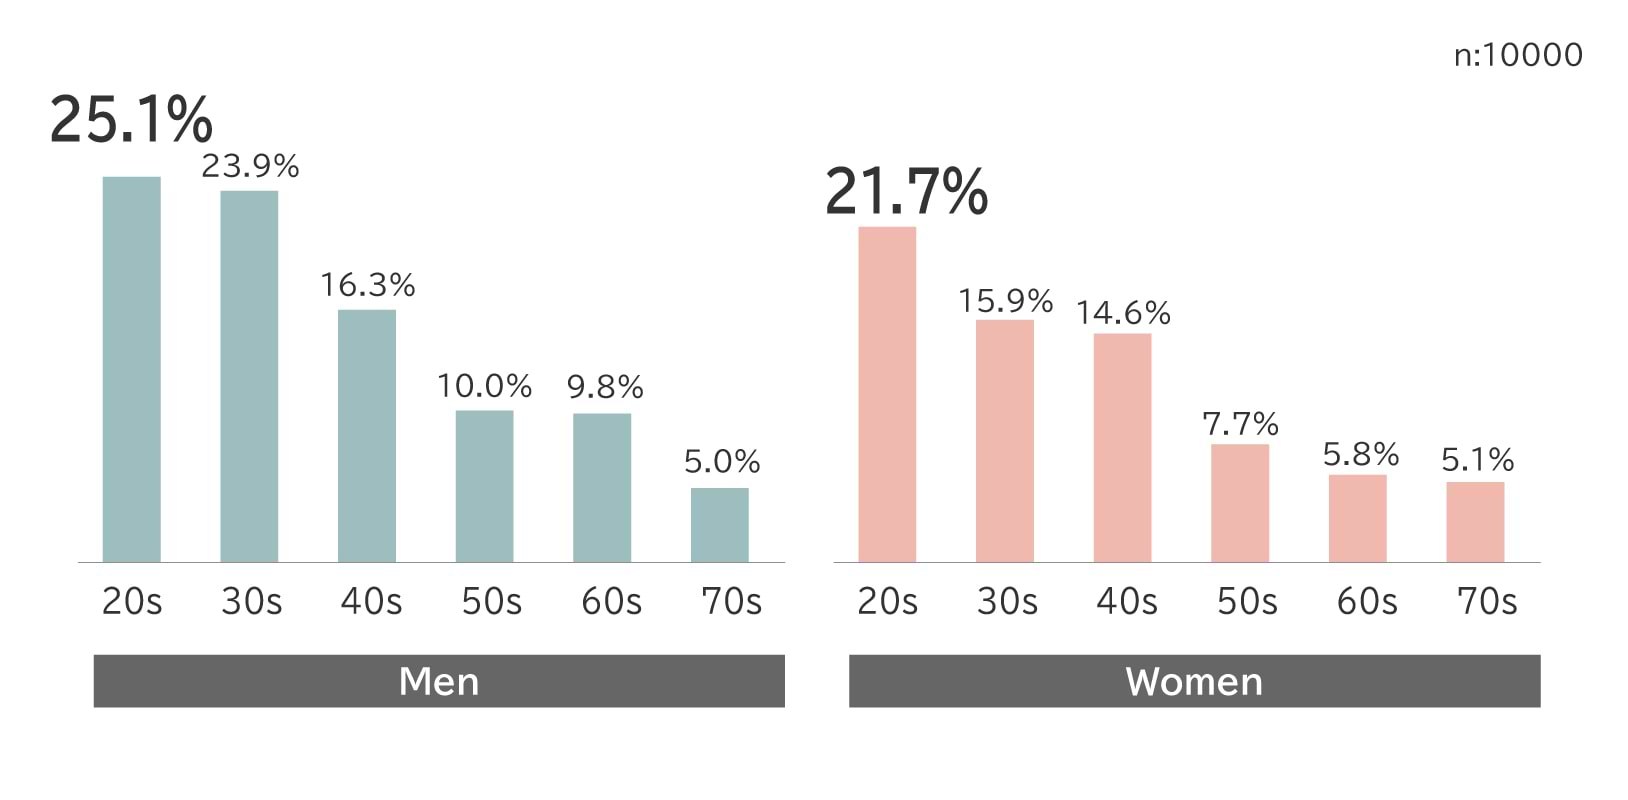 Chart 7
Q.Please tell us about your current usage and future intentions regarding the following healthcare technology-based services and products. (n:10,000)
The combined percentage of respondents who answered "Currently using and intend to continue using" and "Currently using but unsure if will continue/likely to stop" regarding wristwatch-type or ring-type devices that measure heart rate, step count, sleep quality, etc.
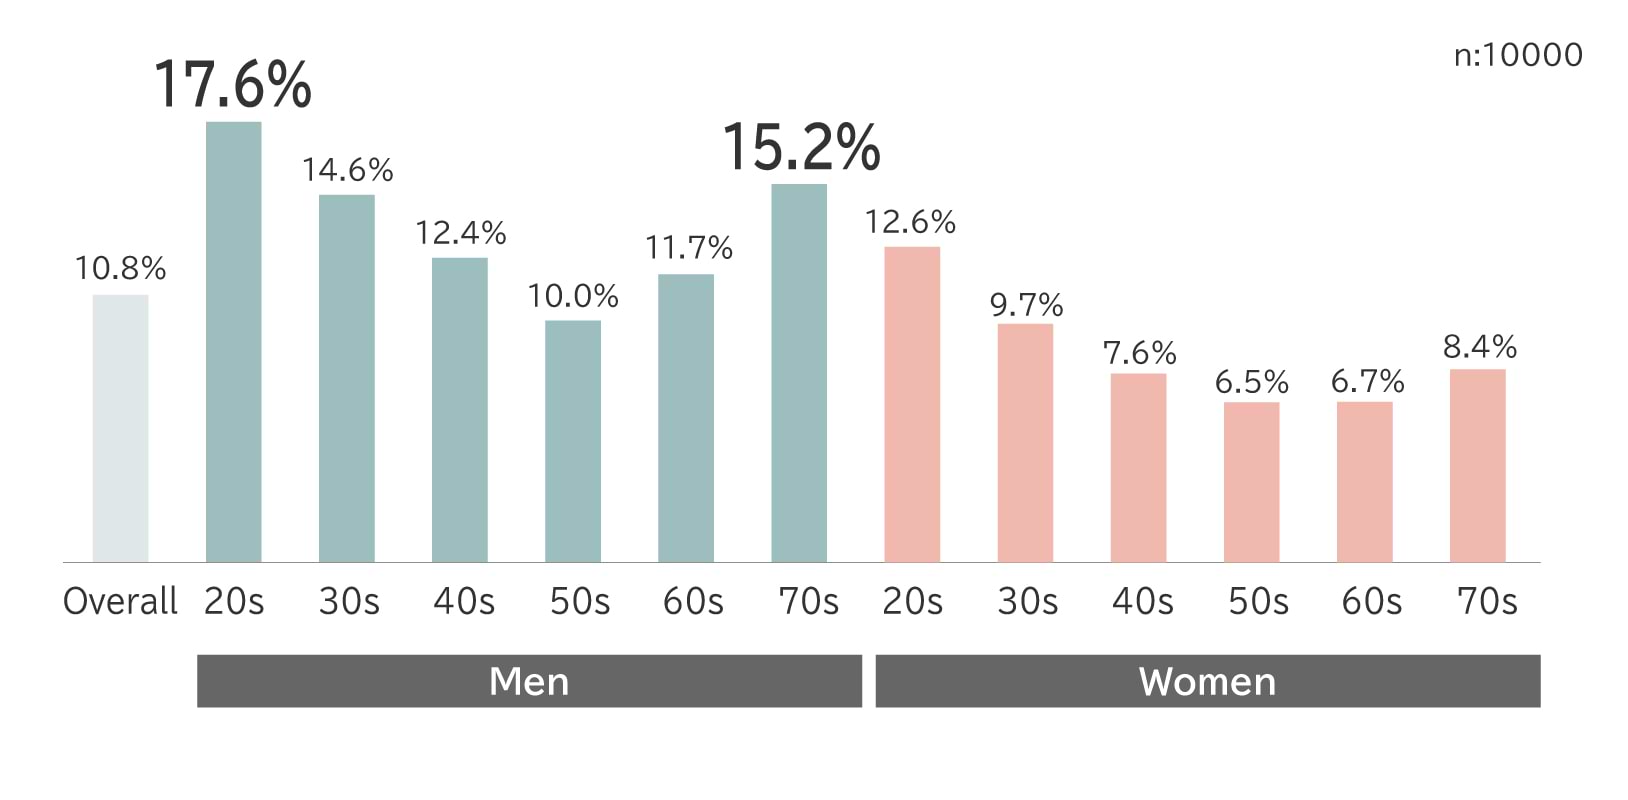
Chart 8
Q.Please tell us about your current usage and future intentions regarding the following services and products utilizing healthcare technology. (n:10,000)
Question about recovery wear that supports fatigue recovery and promotes blood circulation.
 4. Among the 45 health conditions surveyed, the one most commonly addressed through daily dietary habits is osteoporosis (27.9%). The condition most commonly addressed using health foods and drinks, such as Foods for Specified Health Uses (FOSHU), is immunity/resistance (14.8%).
- Among the 45 health conditions that respondents are currently troubled by or wish to prevent in the future, the highest percentage practicing improvement or prevention through "daily dietary adjustments" was osteoporosis at 27.9%, followed by high body fat (27.1%) and constipation (26.5%). The percentage of people taking countermeasures using health foods and beverages, such as Foods for Specified Health Uses (FOSHU) or foods with functional claims, was highest for low immunity/resistance at 14.8%, followed by constipation (12.3%) and infertility (11.9%). (Chart 9)
Chart 9
Q.For health conditions for which you answered "I am troubled by or concerned about on a daily basis" or "I want to be careful about in the future," are you currently taking any measures for prevention or improvement? Please list all actions you are taking for each. (n:10,000)
 5. In the updated healthcare cluster classification system, which categorizes consumers (now including those in their 70s) into eight groups, new clusters reflecting contemporary trends emerged. These include the Smart Conditioners, who meticulously manage their physical and mental conditioning, and the Exhausted Health Postponers, who are concerned about health but rank it lower in priority due to busyness and fatigue of daily life.
- The health awareness/behavior cluster analysis classified consumers into eight types: Active Trendsetters, Smart Conditioners, Steady and Simple, Food Safety Only, Self-Image Driven, Anxious/Stagnant, Exhausted Health Postponers, and Low Awareness/Uninterested. (Chart 10)
- The Active Trendsetters (2,218 yen) spend the most on health-related products, nearly double the amount spent by the lowest-spending Exhausted Health Postponers (1,085 yen). (Chart 10)
Chart 10
Comment from the Dentsu Healthcare Team
Until last year, the "Wellness Survey of 10,000 People" targeted 10,000 men and women in their 20s-60s. Considering the changing social environment, this year we expanded the survey to include those in their 70s. Broadening the age range has made the characteristics of health awareness and behavior by gender and age more evident.
The survey captures practical characteristics by subdividing specific choices within the realm of health awareness and behaviors. Going forward, we hope to extend our analysis beyond gender and age groups to identify the nuanced realities of consumers' health awareness from various angles.
Alongside this change in the survey population, we also revised our classification system of healthcare clusters. The results revealed that five clusters with distinct biases in health awareness and behavior--Food Safety Only, Self-Image Driven, Anxious/Stagnant, Exhausted Health Postponers, and Low Awareness/Uninterested--account for 66.9% of respondents. In addition to the three clusters with high health motivation and literacy--Active Trendsetters, Smart Conditioners, and Steady and Simple--we believe that examining how to approach the clusters with lower health awareness, which comprises about 70% of consumers, is a crucial perspective in the healthcare market.
We hope the results of the survey will provide helpful insights into understanding their consumers for those in the healthcare industry engaged in marketing and business development aimed at promoting healthy behaviors.
About the Dentsu Healthcare Team
Comprising planners specializing in healthcare, the Dentsu Healthcare Team helps clients devise business and marketing strategies across a wide range of areas, including prescription drugs, over-the-counter medicines, food products, toiletries, and health technology. Using data sources such as the Wellness Survey of 10,000 People and the information tool Healthcare Trend Forecast 50 for business development ideation, the team supports business and communication activities within the healthcare sector.
Survey Overview
Objective: To understand the current state of Japan's healthcare market and to predict future trends based on the health awareness and habits of consumers
Sample Area: Nationwide in Japan
Target Sample: Men and women between the ages of 20 and 79
Sample Size: 10,000 respondents (each sample group was weighted to match the national population distribution)
Survey Method: Internet-based survey
Survey Period: From June 6 to 7, 2025
Survey Institution: Dentsu Macromill Insight Inc.
(Reference) Previous Surveys
・18th Survey (Released September 9, 2024. Survey period: June 7-10, 2024)
https://www.dentsu.co.jp/en/news/release/2024/0909-010787.html
#####
Contact
Media-related inquiries:
Branding Office, Dentsu Corporate One Inc.
Email: global.communications@dentsu.co.jp
Survey-related inquiries:
Dentsu Healthcare Team, Dentsu Inc.
Email: dentsu-healthcareteam@dentsu.co.jp